MATLAB-example

1
2
3
4
5
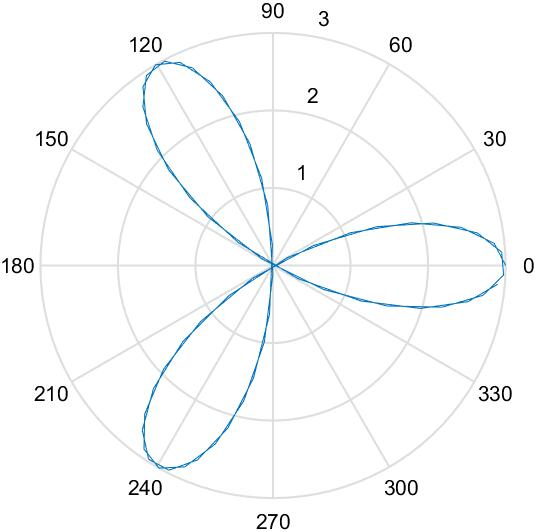
>> theta=0:0.1:2*pi;
>> rho=3*cos(3*theta);
>> polar(theta,rho)
警告: MATLAB 已通过改用 OpenGL 软件禁用了某些高级的图形渲染功
能。欲了解有关详细信息,请点击此处。

ρ=3cos3θ

可以运行的代码如下:

1
![1](\images\matlab\1.jpg)

原来的代码:

1
![1](D:\Blog\myblog\source\images\matlab\1.jpg)

image-20220723204522325


markdown编辑器上面可以看到图片,但是hexo不行(问题已修复)

1
2
3
4
5
6
7
8
9
10
11
12
13
14
15
16
17
18
19
20
21
22
23
24
25
26
27
28
29
30
31
32
33
34
35
36
%% 五星红旗
x=[0 0 40 40 0];
y=[0 13 13 0 0];
k=40/13;
fill(x,y,'r')
hold on
plot(x,y,'r')
axis([0 40 0 13])
seta=pi/6;
R=1.5;R2=0.55;x0=7;y0=9;seta=0;
fliu(R,R2,x0,y0,seta,k)
R=0.6;R2=0.23;x0=15;y0=11.6;seta=-pi/20;
fliu(R,R2,x0,y0,seta,k)
R=0.6;R2=0.23;x0=20;y0=10;seta=pi/20;
fliu(R,R2,x0,y0,seta,k)
R=0.6;R2=0.23;x0=19;y0=7;seta=pi/25;
fliu(R,R2,x0,y0,seta,k)
R=0.6;R2=0.23;x0=16;y0=5;seta=-pi/10;
fliu(R,R2,x0,y0,seta,k)
axis off
function fliu(R,R2,x0,y0,seta,k)
x=zeros(1,10);
y=x;
for i=1:5
x(2*(i-1)+1)=R*cos(pi/2+2*pi/5*(i-1)+seta);
x(2*i)=R2*cos(pi/2+2*pi/5*(i-1)+pi/5+seta);
y(2*(i-1)+1)=R*sin(pi/2+2*pi/5*(i-1)+seta);
y(2*i)=R2*sin(pi/2+2*pi/5*(i-1)+pi/5+seta);
end
x(11)=x(1);
y(11)=y(1);
x=x*k+x0;
y=y+y0;
fill(x,y,[1 0.7 0])
plot(x,y,'y')
end

image-20220723175518205


1
2
3
4
5
6
7
8
9
10
11
%% Flower
clear
[x, t] = meshgrid(0.01:0.01:1, 0.01:2*pi/99:20*pi-0.01);
p = (pi/2)*exp(-t./(8*pi));
u = 1-(1-mod(3.6*t, 2*pi)./pi).^4./2;
y = 2*(x.^2-x).^2.*sin(p);
r = u.*(x.*sin(p)+y.*cos(p));
surf(r.*cos(t),r.*sin(t),u.*(x.*cos(p)-y.*sin(p)))
shading interp
axis equal off
colormap jet
image-20220723180358081
1
2
3
4
5
6
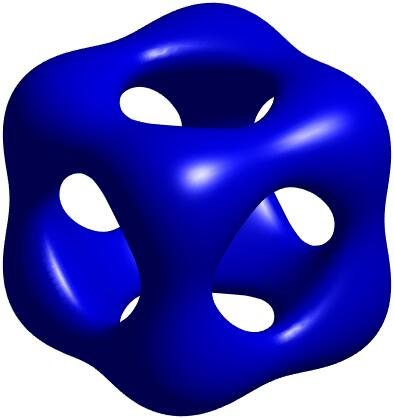
clear
f=@(x,y,z) (x.^2+y.^2-4).^2+(z.^2-1).^2+...
(y.^2+z.^2-4).^2+(x.^2-1).^2+...
(z.^2+x.^2-4).^2+(y.^2-1).^2-14;
figure;fimplicit3(f,'MeshDensity',70,'EdgeColor','none','FaceColor','b');
camlight('right');lighting gouraud;axis equal off

image-20220723202030869


1
2
3
4
5
6
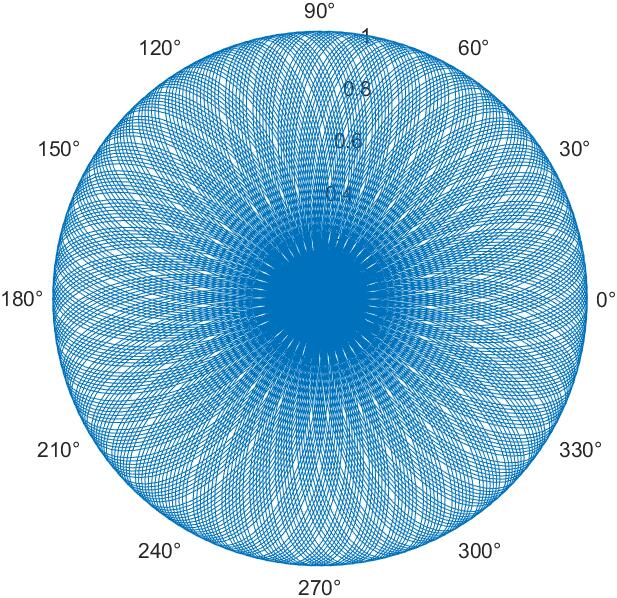
%% Rose
clear
a = 1; n = pi;
theta = linspace(0,100*pi,10000);
r = a.*cos(n*theta);
polarplot(theta,r) % 极坐标

image-20220723202154325


1
2
3
4
5
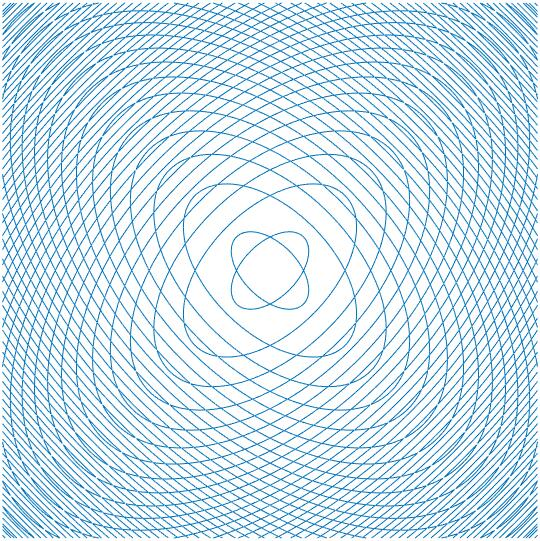
%% 中国结
clear
f = @(x,y) sin(x.^2+y.^2)-cos(x.*y);
figure; fimplicit(f,[-10 10 -10 10],'MeshDensity',2000);
axis equal off

image-20220723202308032


1
2
3
4
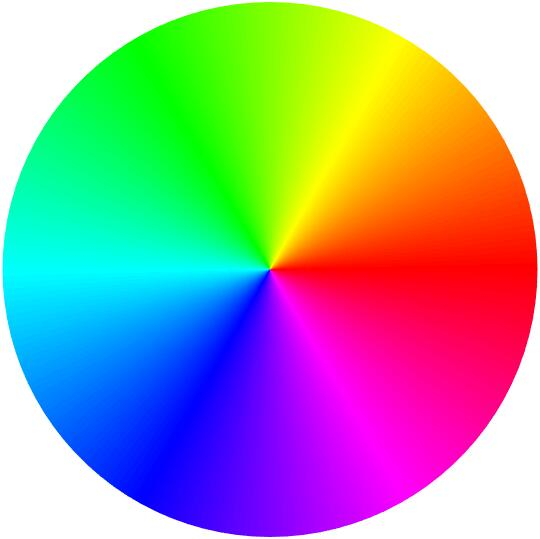
t = (0:.02:2)*pi;
r = 0:.02:1; %r = 0.3:.02:1;
pcolor(cos(t)'*r,sin(t)'*r,t'*(r==r))
colormap(hsv(256)), shading interp, axis image off

image-20220723204244992


1
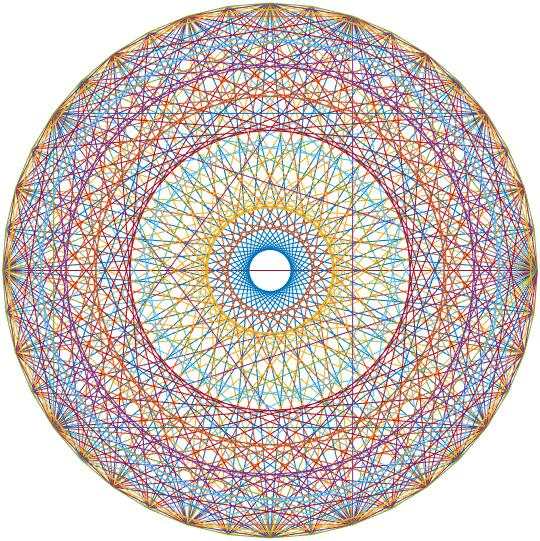
plot(fft(eye(40))); axis equal off

image-20220723204405711


MATLAB-example
https://69asgard.github.io/2022/03/18/MATLABexample/
作者
Alan Root
发布于
2022年3月18日
许可协议